In observance of Community Risk Reduction (CRR) Week, it’s crucial to recognize the diverse fire safety challenges that communities across the United States encounter. We conducted an analysis to uncover how the causes of structure fires vary across the United States, emphasizing the importance of customized fire safety strategies.
Regional Variation in Fire Causes
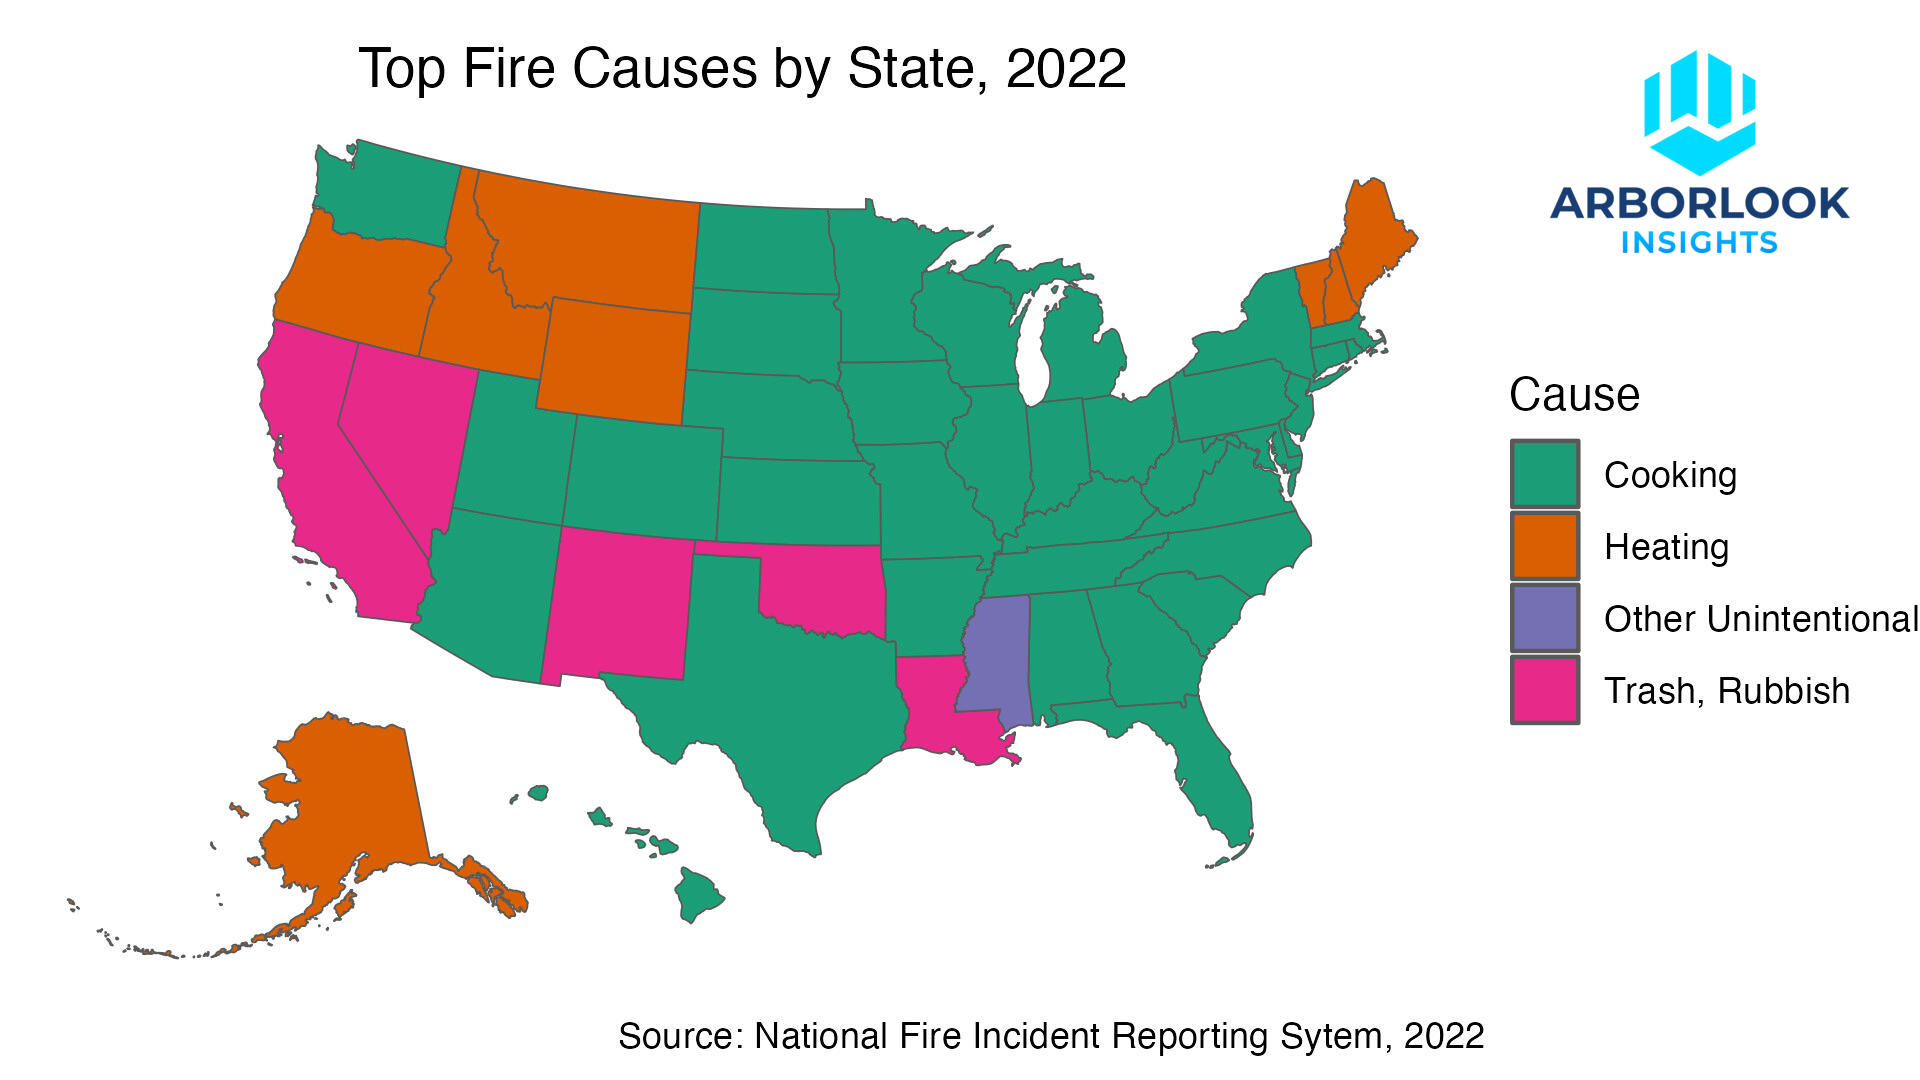
While it’s true that cooking is the leading cause of structure fires across the country, our research reveals a more complex reality. In the colder northern states, heating systems are identified as the primary source of fires, reflecting the influence of climate on fire risks.
Conversely, in certain southwestern and southern states, trash-related fires are more prevalent, highlighting unique environmental and waste management challenges in these areas.
The Significance of Localized Fire Safety Data
As we drill down further in the interactive map below, we see that causes not only vary among states, but they vary within states as well. This variation in fire causes across different regions and localities underscores the need for localized fire safety strategies. Generic data can offer a broad perspective but often misses the nuances of specific areas. This is where in-depth Community Risk Assessments (CRAs) become invaluable, particularly for organizations contributing to the National Fire Incident Reporting System. These assessments provide targeted insights and actionable recommendations, addressing the specific fire risks of a given community.
What’s the top cause of fires in your community?
To further empower communities and individuals in understanding their unique fire safety challenges, we developed a tool available below this post, that allows users to explore the top causes of structure fires in their own area. Enter your state & fire service organization name, or use the interactive map to explore. This tool is part of our commitment to enhancing community safety through accessible, data-driven insights. We believe that informed communities are safer communities, and this interactive feature is a step towards fostering greater awareness and preparedness.
Please note that we have not included all fire service organizations due to insufficient data, and we don’t guarantee accuracy. These data come from the National Fire Incident Reporting System 2022 Public Data Release.
What next?
The tool we provide here is only based on one year of data, and your top fire cause this year may not be your top cause next year. In order to better understand the fire problem in your community, we recommend analyzing at least 3-5 years worth of fire incident data in a community risk assessment, allowing for identification of trends. Get in touch to request a quote for a community risk assessment today.